


With Olymp Trade, here are ten easy ways to trade. A beginner’s’ guide to success on Olymp trade.
Analysis of trends based on patterns found in technical analysis.
Fundamental analysis and technical analysis are both parts of market analysis.
The second is mostly based on watching how the price of the trading instrument moves on the chart and opening trades based on what you see. At the start of the 20th century, this method began to be studied and improved. At the moment, it has a lot of patterns that traders can choose from to find ones that work with their trading strategies.
It’s easy to use technical analysis. Basically, all you have to do is look at the chart and find one of the common price patterns. Since it already tells you where the price is likely to go next, you open a trade in that direction and wait until you can close it with a profit.
On the 30 minute S&P 500 chart shown below, for example, we can see a series of three green candlesticks. This kind of chart pattern often comes before a strong uptrend. So, when traders saw this pattern, they would open a buy trade after it was done, making sure to put a stop loss at the level of the low of the lower candle.
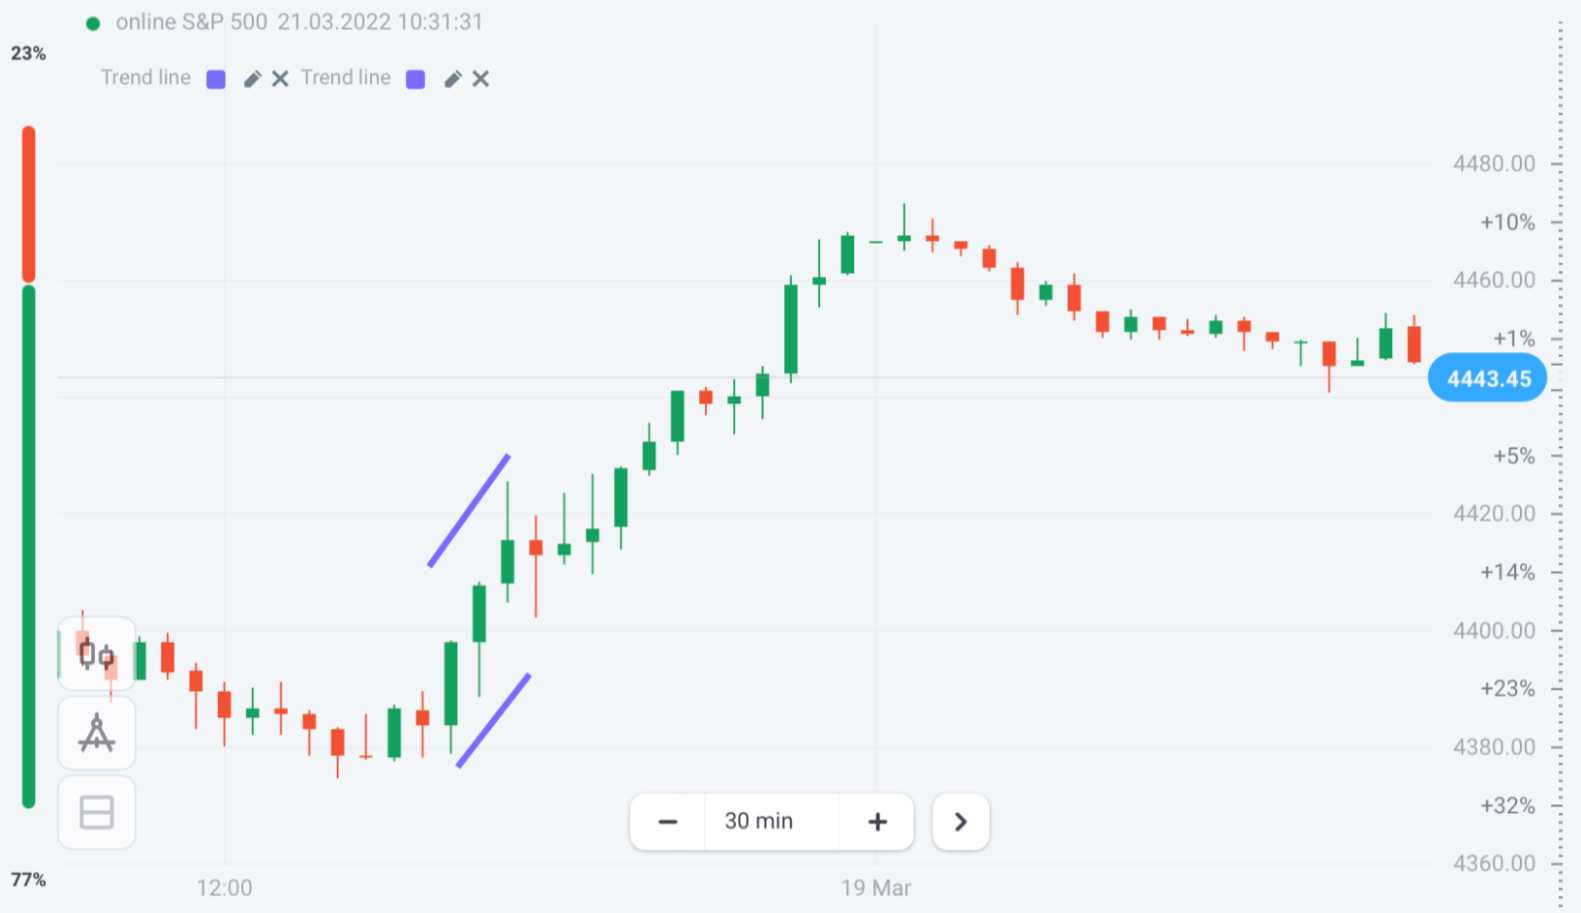
Fig. 1. S&P price performance with an Up chart formation
There are many of these patterns, and you can always see some of them on the chart of the trading instrument you are using. You only need to study them. In the Help Center of the platform, there is a section about candlestick patterns.
As a result, you will have a strong foundation of technical analysis patterns that can be used to build simple trading strategies that are ready to go.

Trading on news about the economy
Fundamental analysis is basically trading based on news that could change the price of the trading instrument you are interested in.
Some examples of this kind of news are big company announcements, quarterly earnings reports, a change in CEOs, monetary policy reports and interest rate press conferences by national banks, employment data, inflationary trends, global oil consumption, production forecasts, and much more.
Almost every day of the week, all year long, there is news that can be used to trade. With Olymp Trade’s Insights, you can find this news, figure out what asset it’s about, and open a trade in the direction that makes sense.
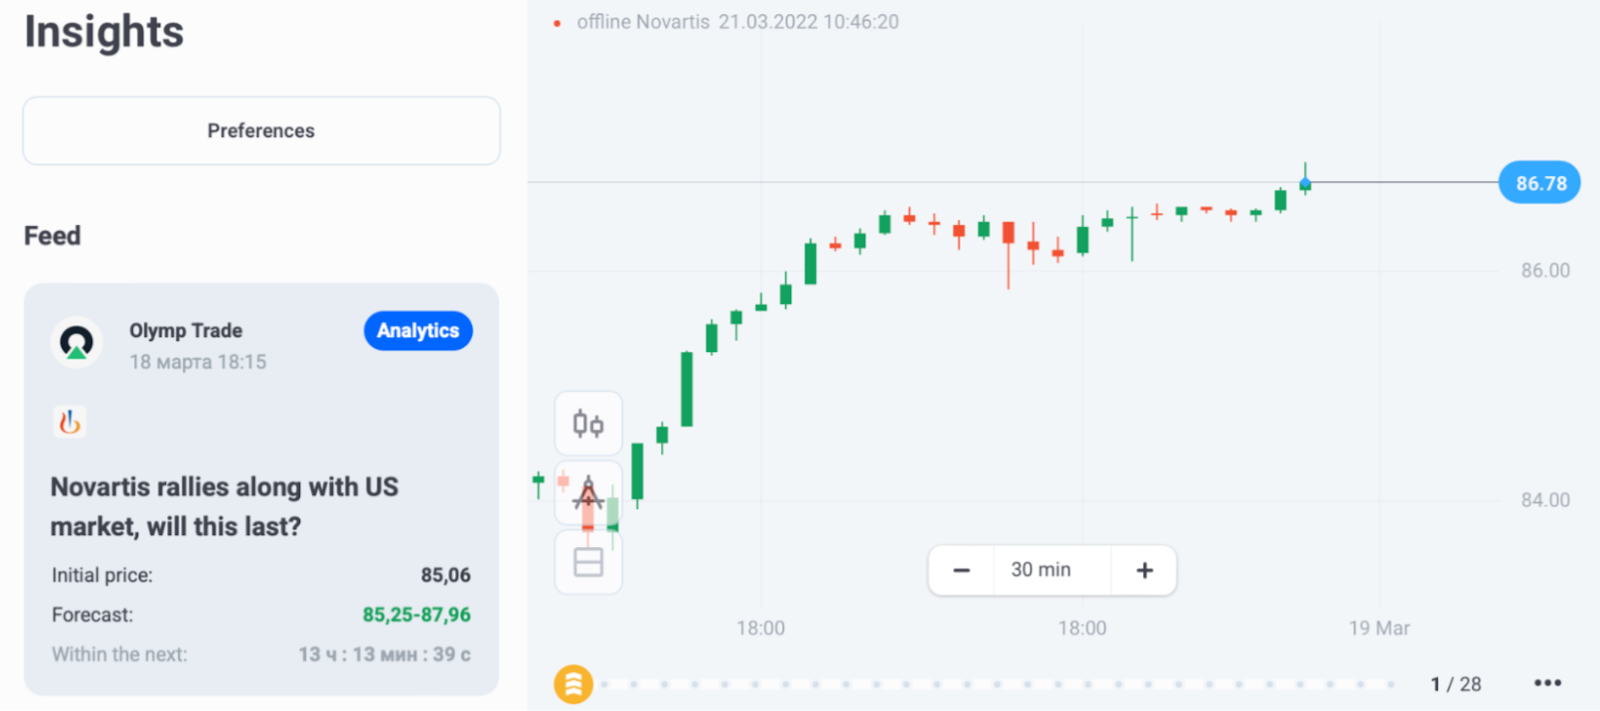
Fig. 2. Olymp Trade’s Insights in the left sidebar opened from the Help Center
Buying and selling based on earnings reports
We’ve already talked about the fact that you can trade on corporate earnings reports as a basic way to trade on economic news. But trading based on earnings reports is so common that it needs its own explanation of why it’s a good idea.
First, you can often trade based on earnings reports. Every three months, companies talk about how they did. Second, most reports come out at the same time every three to four weeks. This time period is often called “earnings season.”
You can use the two “empty” months to learn about the stocks you want to trade. Later, when it’s time to report, you buy and sell all the stocks at once.
Third, you can’t miss earnings season because the Olymp Trade platform will tell you ahead of time. Also, it will keep telling you what reports come out each week and give you advice on how to open trades based on them. You can also learn more about earnings season by reading the Help Center’s section on the subject.
Finally, it’s not unusual for the news to cause big price changes. Since this is the case, the earnings reports could be a good way to make money.
For example, the long red candlestick on the chart below shows what happened to the price of Meta (Facebook) stock after it reported its earnings in February 2022.
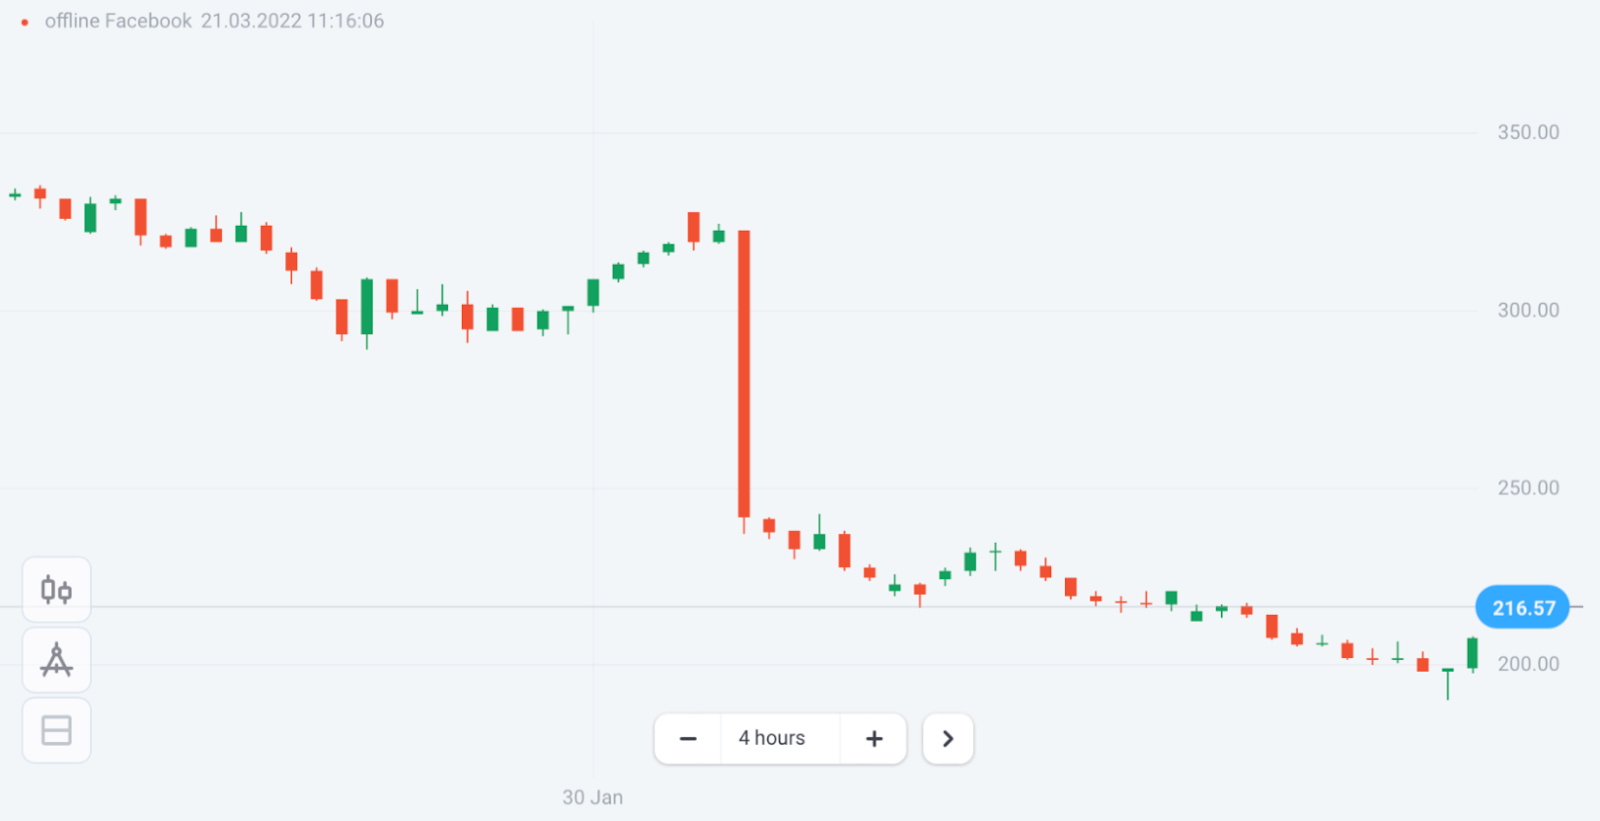
Fig. 3. Meta (Facebook) price chart with a large Down candlestick
Price Action
Price action is best for trading within the same day. It is mostly based on figuring out where support and resistance levels are in relation to how the candlesticks are shaped. Usually, this helps find points where a trend changes or speeds up. These are often very good places to get into a market.
On the NZD/USD chart below, for example, we can see a slight upward trend. As long as the price kept going back and forth to the resistance line, it kept forming. Later, it was broken with confidence, and the price went on to settle at higher levels. So, when traders saw this resistance line break, that would have been a good time to start a buy trade.
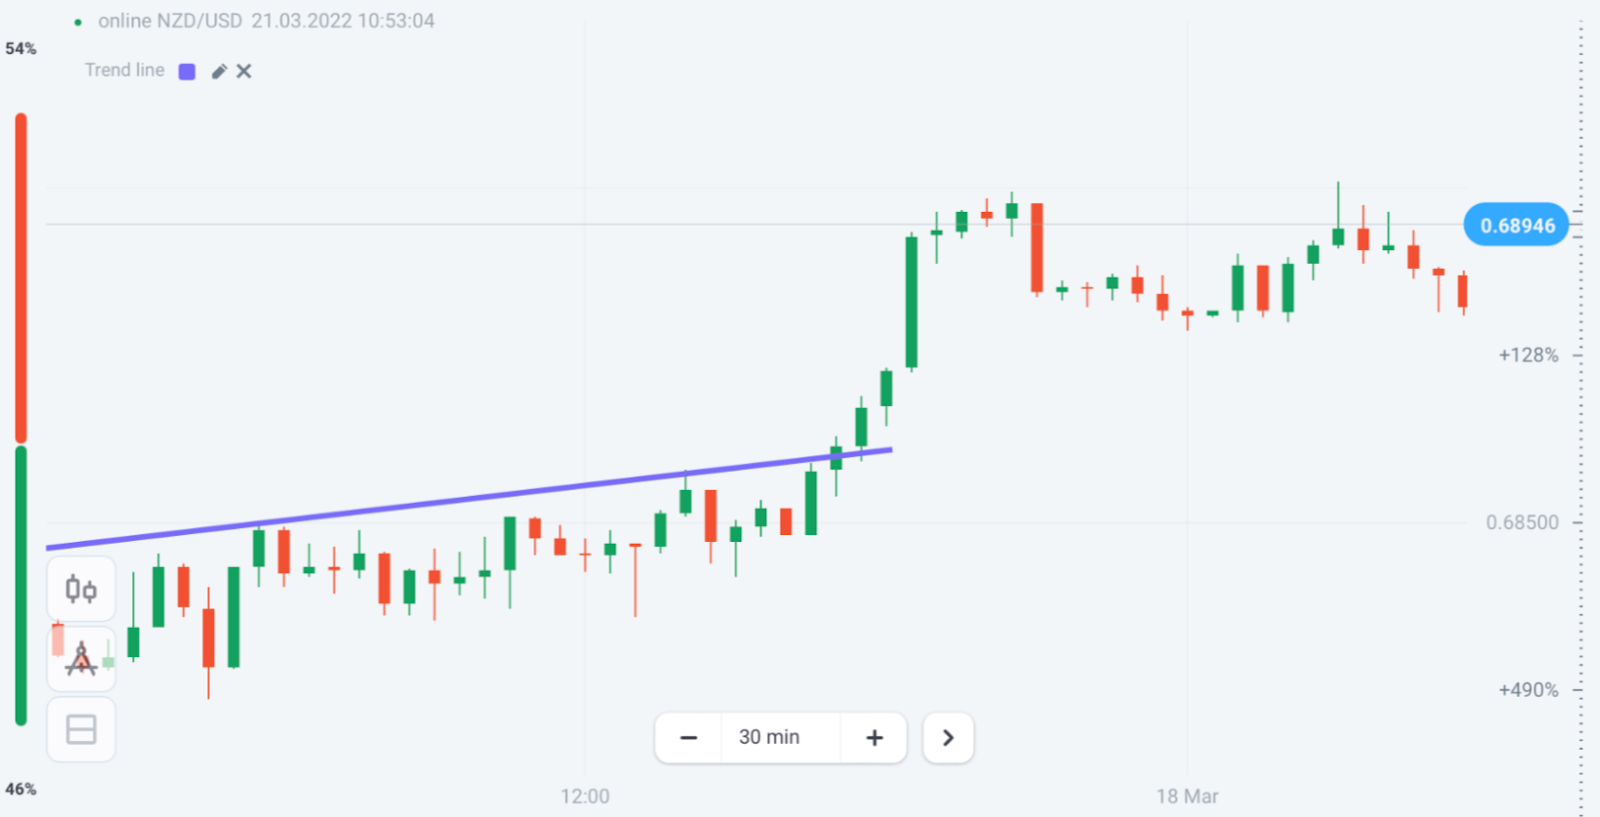
Fig. 4. NZD/USD price chart with an uptrend
Fibonacci methods
Fibonacci Levels and Fibonacci Fan are two of the Fibonacci indicators that can be found on the Olymp Trade platform. You can find them in the Indicators menu.
The Fibonacci indicators are ready-to-use technical tools that show where the price is likely to change direction or speed up.
As a result, they can be used to find good signs to get into the market.
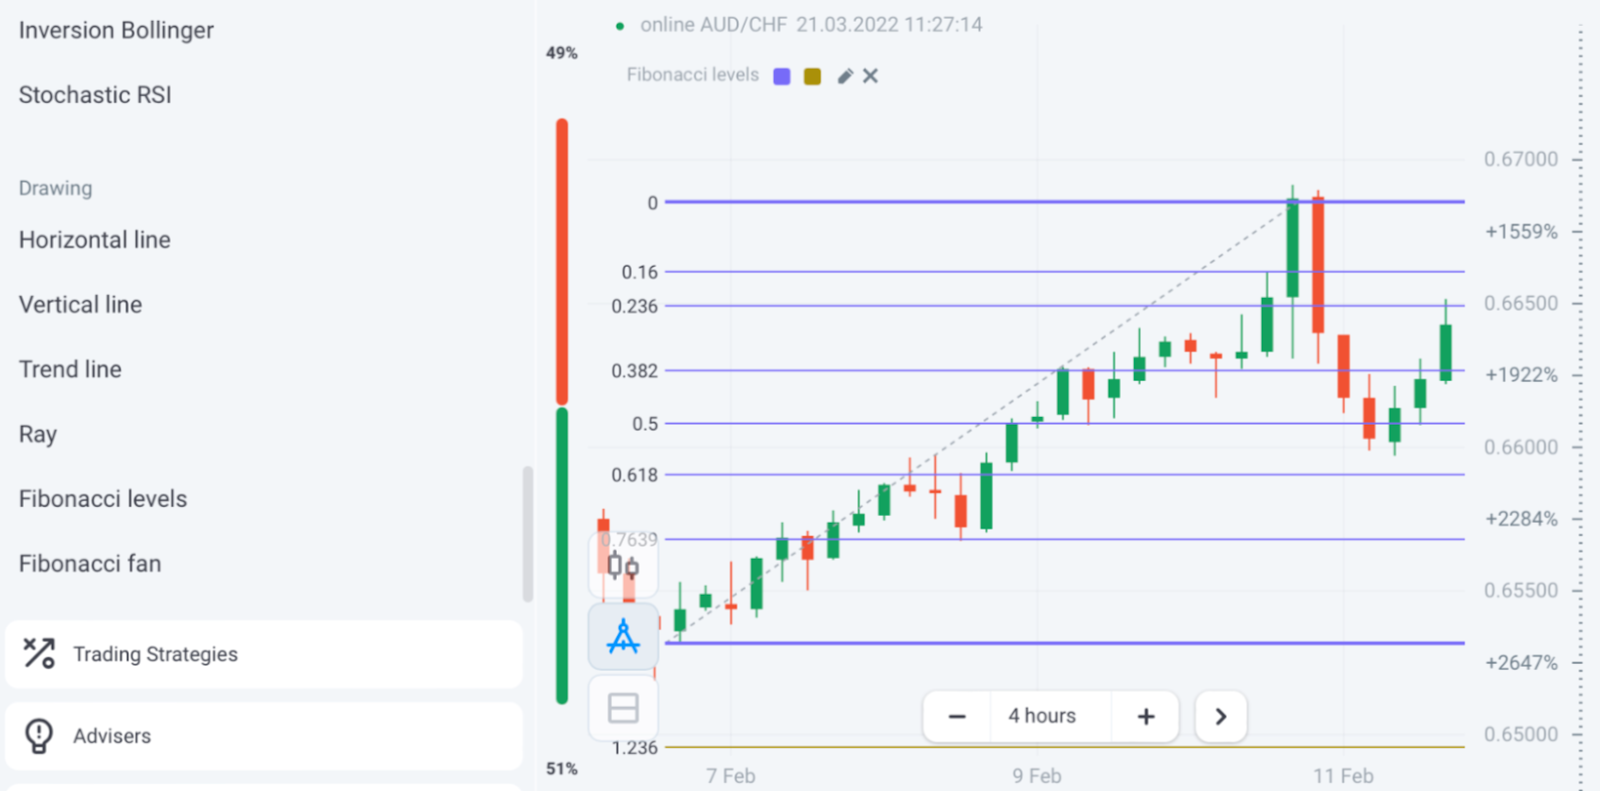
Fig. 5. AUD/CHF price graph with the Fibonacci Levels indicator charted on it
Oscillators
Trend reversals may be a very good intraday trading strategy. This is a great use for oscillators.
Oscillators are a type of technical analysis tool that shows how strong a trend is at a given time and if the price is in the “overbought” or “oversold” zone. This is a sign that the trend might be changing.
On the Olymp Trade platform, the Indicators menu is where you can find oscillators. This section has a list of the most popular oscillators, such as the RSI, MACD, and Awesome Oscillator.
If you look at the 1 hour chart of EUR/GBP, you’ll see that the price is lowest at 0.8380, which is where the purple line of the RSI falls below 30. The oversold zone is there.
Once the RSI crossed that level from the bottom up, it would mean that a new uptrend was starting and that it was time to buy. Here’s an example of how useful an oscillator can be.
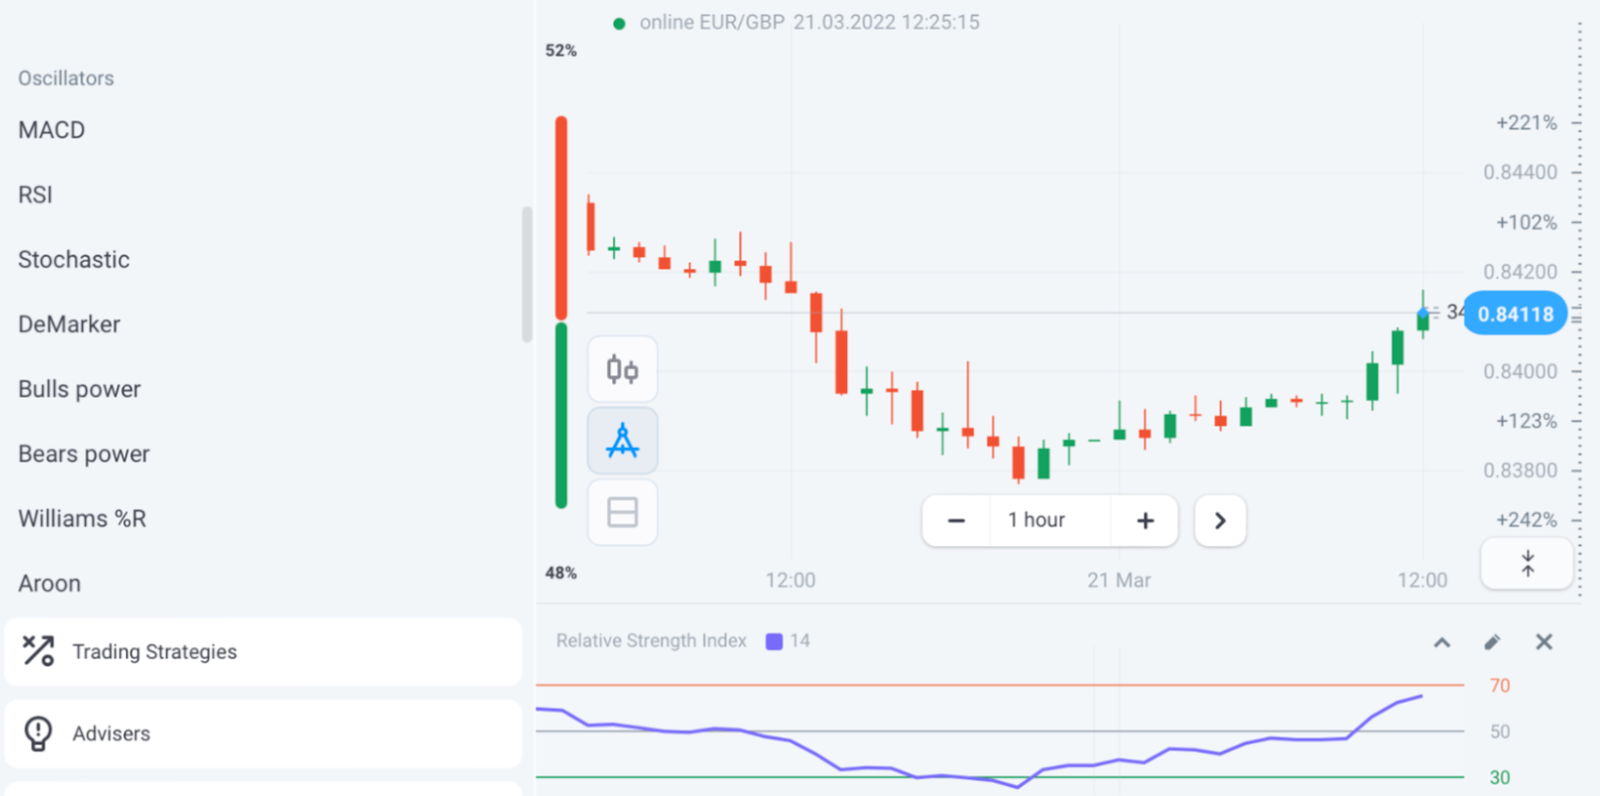
Fig. 6. EUR/GBP price graph with the RSI indicator charted below
Strategies for trading against trends and trading psychology.
Trading on “scary” news is another part of news trading, which is part of fundamental analysis on a larger scale.
This strategy is based on the idea that the market responds quickly to any big bad news. It doesn’t matter if such a release turns out to be a real economic or political threat in the long run. People make up the market, and people feel things. So, they often have a strong emotional reaction to something that may just be a private opinion or one of many possible outcomes.
For example, if oil production around the world is threatened, the price of Brent may go up. So, an oil trade could happen if there was a security problem at an ARAMCO site in Saudi Arabia or if there was a military escalation in the Middle East that affected oil-producing countries like the UAE or Iraq.
Or, any big geopolitical tensions that world leaders talk about could also be news to trade on. During the economic fight between the US and China in 2018, the media often used scary quotes from country leaders and experts to make money.
In the end, the stock market lost up to 30% of its value by the year 2020, when the news came out about how Covid-19 spread, what it did, and what it meant. So, if you wanted to take advantage of the panic on the market, that was the right time to do it. In the future, this type of trading could be done on any news like this.
Moving Averages
The Simple Moving Average, or SMA, is one of the best and easiest-to-use ways to see how prices are moving.
One of the easiest ways to use it is to see if the price of a trading instrument went above or below the SMA.
If the price goes up and crosses the SMA up, this is a sign to open a trade going up. If the price goes down and crosses the SMA down, this is a sign to start a trade going down.
On the Litecoin chart below, for example, the price went below the 50-period SMA. After staying there for a while, it confidently crossed the SMA up. For many traders, that would mean opening a trade in the direction of the uptrend after that upward crossing.
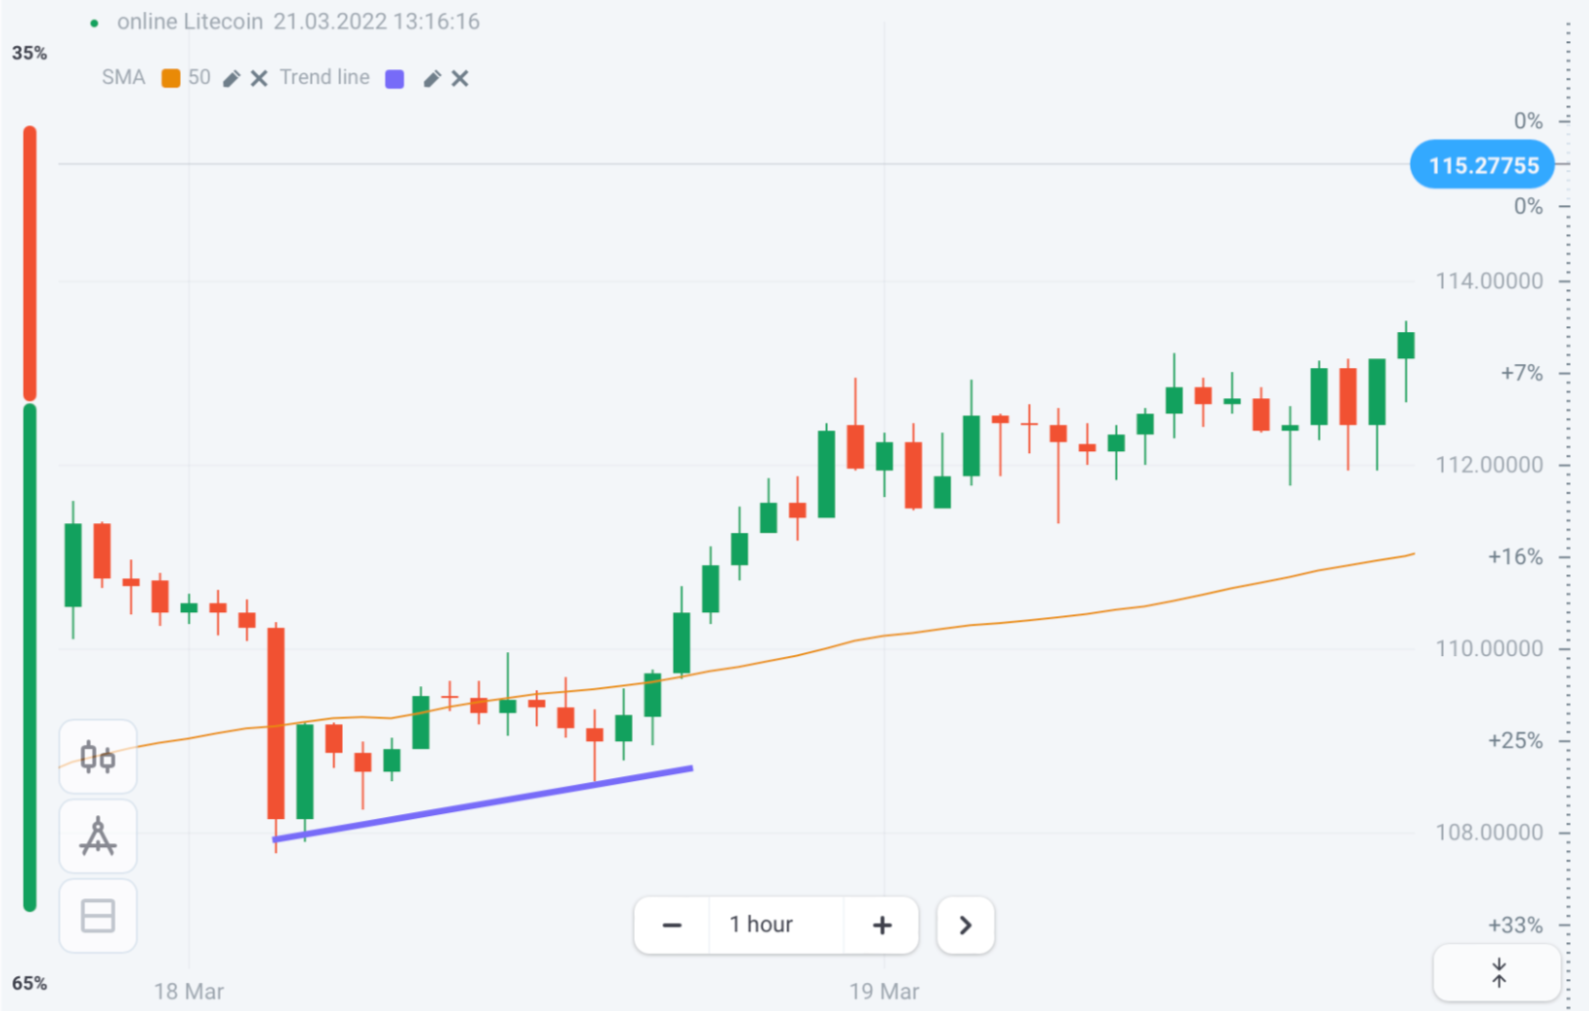
Figure 7: A graph of the price of Litecoin with the SMA indicator marked on it.
Use Olymp Trade’s signals and analytics to trade
The experts at Olymp Trade regularly put out a wide range of analytical reviews that you can use to trade.
These expert analytical reviews give price predictions for different trading instruments, which can help traders make quick, well-informed choices.
Also, you may find useful information on the Olymp Trade platform about advisers and trading signals. Both can be effective technical tools to improve the outcome of your trading process.
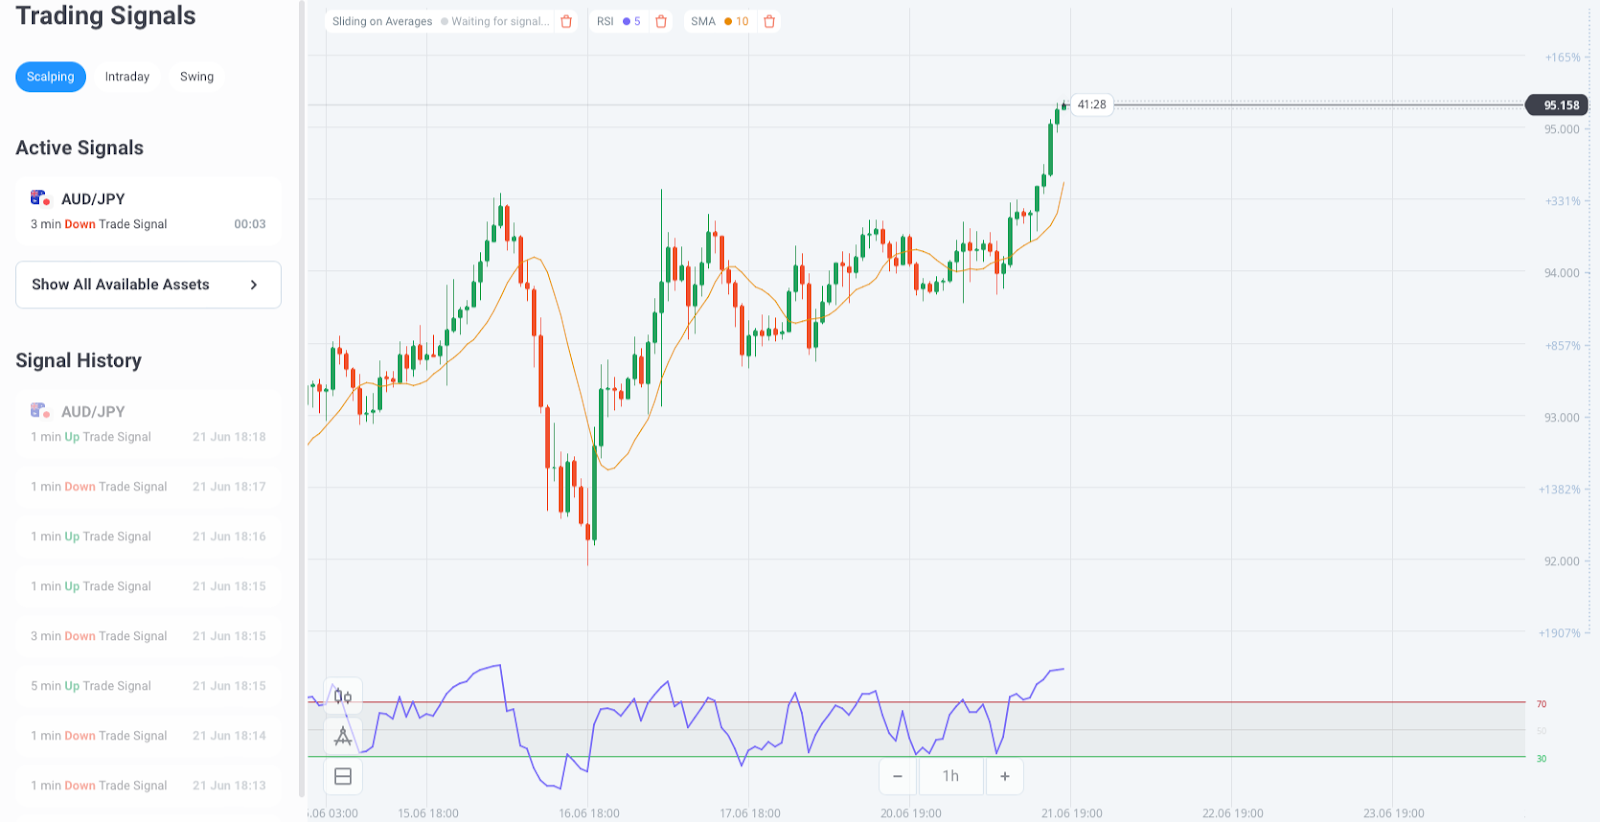
Figure 8: The trading signals for Olymp Trade are on the left side of the platform.
Personal Consultation
With Olymp Trade, traders can use the help of a personal trading consultant to reach higher trading levels quicker. Both the Advanced and Expert levels have this option, but it comes up less often for the Expert level.
Expert traders can have four personal consultations every month, while advanced traders can only have one.
In both cases, these consultations are scheduled through Olymp Trade’s support department.
This tool can help traders come up with a personalized way to learn that gets them to the level of trading they need faster. Also, they get to see how an Olymp Trade expert makes trading and risk-management decisions in the real world.
Discover and Combine
This list doesn’t include all of the different ways you can trade with Olymp Trade. Instead, it shows you different paths you can take to find the ones that work best for your trading goals.
Olymp Trade strives to bring you the tools you need. You can check them out at the Help Center. Also, find out what each status gives you in terms of benefits.